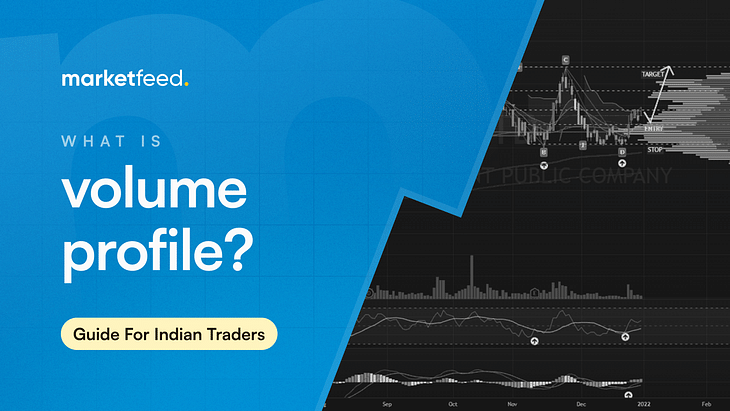
Understanding Volume Profile: A Powerful Tool for Traders

Volume is one of the most critical elements when analysing a stock’s price chart. Traditionally, traders analyse volume with respect to time. However, what if you could analyse volume with respect to price instead? This perspective unlocks a new layer of understanding in trading. Enter the Volume Profile—a versatile tool that gives traders insights into price levels with significant trading activity. In this article, we dive deep into understanding, using, and applying volume profile in trading.
What Is Volume Profile?
Volume Profile is a charting tool that plots trading volume against price rather than time. By doing so, traders can identify crucial price levels where significant activity has occurred. These levels often serve as strong support and resistance zones. Unlike traditional volume indicators, Volume Profile highlights areas of high liquidity where the price tends to gravitate and zones of low liquidity where the price can move rapidly.
Let's Look at an Example:
Consider Raju, an onion wholesaler. Raju deals with highly volatile onion prices daily. He wants to know at what prices he sells the maximum and minimum quantities. By visualising onion prices and quantities sold on a chart, he discovers the most significant price levels. Similarly, traders can use Volume Profile to identify the most traded price levels for a stock, helping them understand key support and resistance zones.
Key Components of Volume Profile
1. Point of Control (POC): The price level where the highest volume of trades occurred. This level often acts as a pivot point for price action.

2. High-Volume Zones: Zones with significant trading activity. These areas create a “gravitational pull,” slowing down price movement.
3. Low-Volume Zones: Zones with minimal trading activity. Prices can move quickly through these areas due to low liquidity.

4. Fair Value: The range where 70% of all trades occur. Prices often oscillate within this range, creating a balance zone.

Volume Profile provides actionable insights by uncovering patterns hidden within price and volume data. Next, let's discuss how traders can interpret various scenarios.
Candlestick Analysis with Volume Profile
1. Bullish Candle: If the price closes above the fair value zone, the candle is bullish. Buyers demonstrate strength by breaking out of high-liquidity areas, suggesting upward momentum. For example, if a green candle closes above its POC, the POC may act as a strong support level in subsequent sessions.

2. Bearish Candle: A red candle closing below the fair value zone indicates bearish sentiment. Sellers overpower buyers, pulling the price down. In this case, the fair value acts as a resistance zone.

3. Neutral Candle: When the price closes near the fair value, the candlestick is neutral, signalling indecision. Analysing multiple candles in such cases is essential to identify the prevailing trend.

4. Trend Reversal Candles: In some cases, the price moves strongly during the day but gets trapped in the fair value zone by the close. For instance:
(i) Bullish to Neutral Reversal: Price rises quickly in a low-liquidity zone but closes in the fair value range.
(ii) Bearish to Neutral Reversal: Price falls rapidly through low liquidity but closes in the fair value range.
These scenarios indicate potential reversals for the next trading session.
Intraday and Swing Trading with Volume Profile
- Intraday Traders: Analysing the previous day’s Volume Profile helps anticipate trends for the next session. Key levels like POC and high-volume nodes provide critical zones for support and resistance.
- Swing Traders: Longer-term trends can be identified by studying the Volume Profile over a week or month. Consolidation patterns and high-volume zones help traders understand upcoming support and resistance levels.
Step-by-Step Guide to Using Volume Profile
1. Open Your Charting Platform: On platforms like TradingView, navigate to the “Forecasting and Measurement Tools” section.
2. Select Fixed Range Volume Profile: This tool is ideal for analysing volume over two fixed price ranges.
3. Plot the Volume Profile: For instance, when analysing Cochin Shipyard stock, you can plot the day’s Volume Profile to identify key levels.
4. Adjust the Fair Value Range: By default, 70% of trades are highlighted. Reducing this to 35% narrows the focus, enabling better insights into key zones.
5. Analyse the Data: Use the plotted profile to identify the day’s fair value, POC, and high/low-volume zones.
Example: Suppose Cochin Shipyard’s stock forms a red daily candle and closes inside its fair value zone. This indicates a potential reversal, as sellers couldn’t sustain their momentum. The next day’s trend might see the price bounce upward from this fair value zone.

Why Volume Profile is Essential
1. Enhanced Market Understanding: By analysing volume at price levels, traders gain a clearer picture of market dynamics.
2. Improved Accuracy: The tool helps pinpoint high-probability support and resistance zones.
3. Combination with Other Tools: Volume Profile complements other technical analysis techniques, enhancing their effectiveness.
Conclusion
Mastering the Volume Profile can significantly improve your trading strategy. By understanding volume in relation to price rather than time, you unlock new dimensions of analysis. Whether you are an intraday trader or a swing trader, incorporating this tool into your arsenal will increase your trading success rate. So why wait? Start exploring Volume Profile today and take your trading skills to the next level!


Post your comment
No comments to display