Jargons
What is India VIX? Find it here!
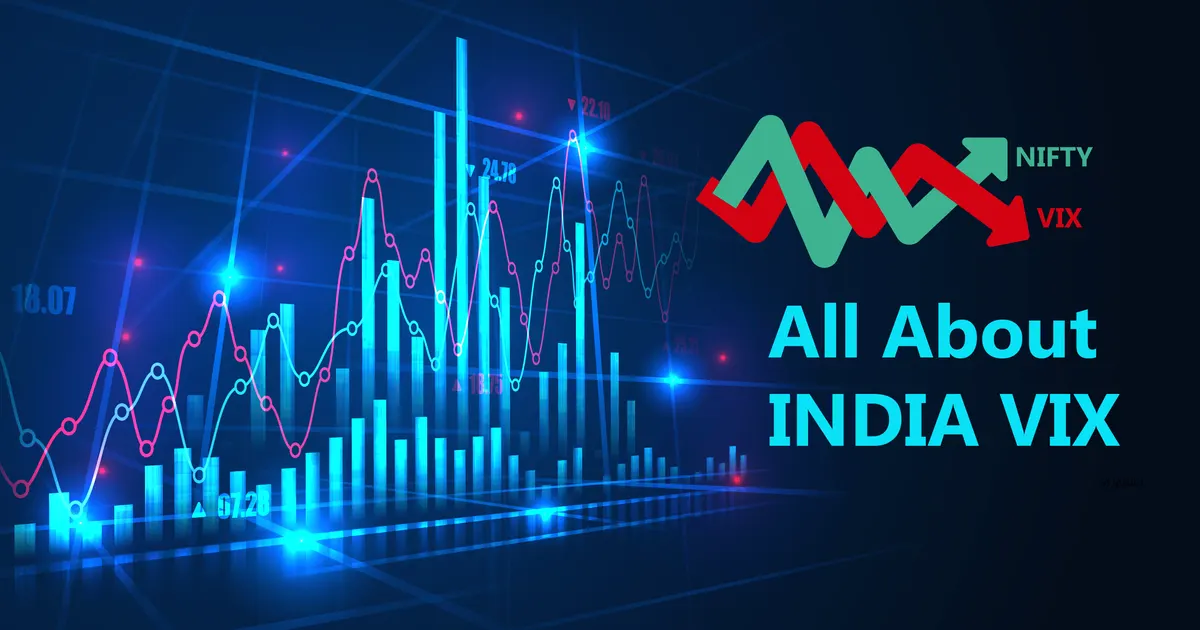
India VIX, or India Volatility Index, measures the expected volatility in the Indian market, specifically the annualized change expected in the Nifty 50 over the next 30 days. It is a trademark of the Chicago Board Options Exchange, licensed to the National Stock Exchange of India.
Key takeaways
- India VIX stands for India Volatility Index and indicates the expected volatility in the Indian market.
- The calculation of India VIX uses NIFTY Index Option prices and represents the annualized change expected in the Nifty 50 for the next 30 days.
- India VIX and Nifty typically move in opposite directions, as seen during Covid-19 in March 2020 when India VIX touched 83.63.
- A higher India VIX indicates higher risk for retail investors, and equities may not be safe when it is unusually high.
- India VIX is not a tradeable index and is considered normal around the 20-mark, which it was in April 2021.
You must have seen us talking about India VIX on The Stock Market Show on YouTube and our Pre-Market Reports. But are you really aware India VIX is? Does it tell you something about the market? How should retail investors read this parameter? Find all about this here!
India VIX
VIX stands for Volatility Index. This tells that India VIX is nothing but India Volatility Index. It tells about the volatility which can be expected by the investors in the Indian market. In simpler terms, volatility is referred to as the “rate and magnitude of changes in prices" expected in either direction. Originally, VIX is a trademark of the Chicago Board Options Exchange. The National Stock Exchange of India (NSE) has been granted a license to use this mark with the name of India VIX.
The calculation of this volatility index is done with the help of the NIFTY Index Option prices. It is the representation of the annualized change that can be expected in the Nifty 50 for the duration of the next 30 days. Do focus on the word annualized change. Let’s take an example to make it clearer.
Suppose India VIX is 20.97%. That means for the next 30 days, Nifty 50 is expected to move in either direction by the investors by an annualized rate of 20.97%. The value of VIX cannot go below 0 and cannot exceed 100.
How Does Vix Affect You?
It has been seen previously that VIX and Nifty move in opposite directions. We saw the biggest example of this during Covid-19 last March. On 24th March 2020, India VIX touched the mark of 83.63! This is when the market was unpredictable due to the Covid-19 lockdowns around the world. But, do not judge the direction of the market with the movement in VIX. The India VIX will only tell how big a move can happen in the market irrespective of the direction.
The higher the VIX, the higher the risk is for retail investors. Equities may not be a very safe asset class when VIX is unusually high. India VIX is said to be normal if it is around the 20-mark, which it is currently at as of April 2021.
You cannot buy/sell India VIX, it is not a tradeable index.
Frequently asked questions
What does India VIX stand for?
India VIX stands for India Volatility Index.
How is India VIX calculated?
The calculation of India VIX is done with the help of the NIFTY Index Option prices.
What does an India VIX of 20.97% mean?
If India VIX is 20.97%, it means that for the next 30 days, Nifty 50 is expected to move in either direction by an annualized rate of 20.97%.
Can you buy or sell India VIX?
No, you cannot buy or sell India VIX as it is not a tradeable index.
Written by
marketfeed TeamRelated reads
What are Technical Indicators: Definitions and Types?
Understand technical indicators: what they are, how to plot them, their types (overlays, underlays, lagging, leading), and tips for effective use in trading.
What is Volume in the Stock Market? How to Analyse It?
What trading volume means, why it confirms or rejects a price trend, and how to apply volume analysis and the Volume Profile in real trades.
The BEST Framework to Create a Diversified Stock Portfolio
Learn the best framework to create a diversified stock portfolio for long-term success. Understand asset, market cap, and sectoral diversification for optimal returns.
Join 2.4M+ Indians · Free · 2 min